“What’s the ROI of your recent social media campaign?”
“Awesome! We gained 2000 more followers on Twitter, got 102 retweets. And, on Facebook, it was shared 65 times…”
Super exciting, but hardly insightful. How did it help your bottom line?
As a social media marketer, you’ll have to share your results – good and bad. Present your social media reporting to your organization, your client, your CEO. Explaining your goals and your achievements. Proving the value of your team. Sharing this information is important. But, which numbers matter? What should you share? Why should you bother?
It can be a pain, translating social media results into something that’s going to be understood by everyone. It would be foolish to assume that your CEO understands how social media really works, or gets what you do all day in the office. Your social media reporting will educate. It’ll present your goals, strategies, and successes. It’ll explain your failures and your fixes.
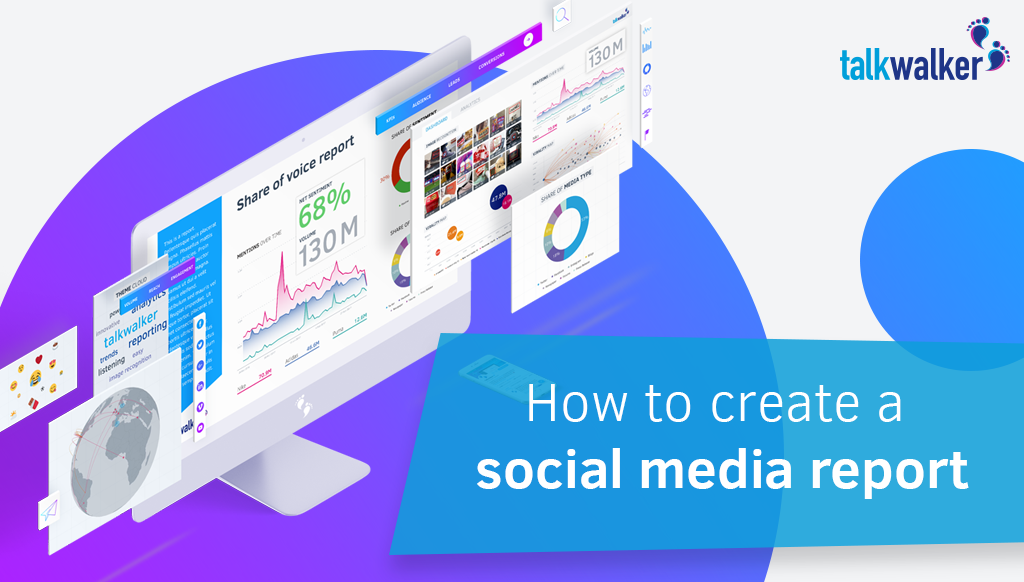
I’ve written a guide – How to create a social media report – that explains why reporting your social media results is so important. For you, your team, your CEO, your organization, and for all your future social media marketing campaigns.
The guide includes seven steps to insightful social media reporting. All that you need to cover, the metrics to track, and a tool that covers both the analytics and automated reporting. The reports you schedule will depend on your business goals and what you want to prove. What makes this guide unique are three simulated reports that you can download. They demonstrate how awesome your reports can be – depth of insights, graphics, and presentation.

Why doing social media reporting is important
Your team has created some brilliant campaigns. They increased engagement, brought in new users, leads, and followers. But, if you can’t prove this in your organization…
Remember what I said earlier? Never, ever assume that everyone gets social media like you do.
- Measure the ROI of your campaigns and prove their value and that you’re meeting business goals
- Show your clients how their social accounts are evolving
- Identify your successes and your failures so you can improve, repeat, delete
- Compare social channels and concentrate on the ones your audience favour
- Find which content works, bringing high engagement, with your target audience
- Compare your strategies with those of your competitors so you can copy and find new opportunities
7 steps to social media reporting
#1 Identify stakeholders
Who needs to see your reports? Which teams – sales, customer support, demand gen, senior management? Tailor per team – for instance, sales will want to see different data than your CEO.
#2 Set your goals
What do you want to prove, to justify? This will determine which reports you’ll need to create.
#3 SMART questions
Be SMART and identify the questions you want to answer. Example: did your campaign inspire chat within your audience?
#4 Which metrics to track
It’s a long list, and to see in more detail, check out the full social media reporting guide.
- Leads
- Conversions
- Reach & impressions
- Volume
- Engagement
- Audience
- Content
- Click-thru with bounce rate
- Share of voice
- Lessons learned
- Executive summary
#5 Choosing a social media reporting tool
Decide on your priorities and goals before looking for the best tool. Ask questions:
- Where does the tool source its data?
- What’s the data quality?
- Does it track the channels you use?
- Will it track globally – multiple languages?
I’m guessing at this point that you’re feeling overwhelmed with the work involved. Don’t be.
It’s all about choosing the right social media reporting tool. Included in my How to create a social media report guide, I’ve included a cheat sheet. It lists all the questions you should ask a tool provider, to ensure you get the one that works best for you. Look and learn.
#6 Choosing reporting time frames
- Daily reporting
- Punctual campaign report
- Monthly report
- Quarterly strategy review
#7 Presenting your report
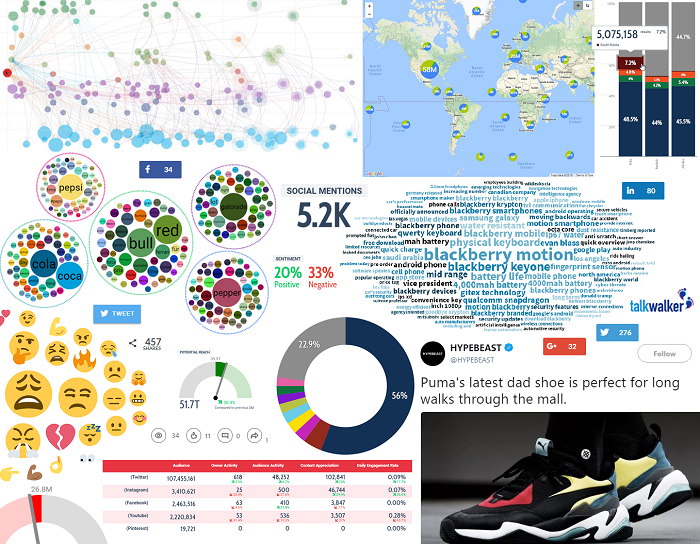
Make them pretty! Humans understand images and find it easier to retain the data if it’s presented visually. Include charts, graphs, virality maps, word clouds, examples of your social posts. A short description with takeaways and analysis highlights will explain what’s being shared. And remember… don’t terrify your audience! Clearly explain anything that appears negative – why it happened, what it really means, what your going to do.
 Use a mix of visuals to support and explain your results.
Social media reporting
You’ve established the time frames of your various reports. But what should you be looking at? What should you be reporting about your brand? Below are some ideas. If you hop over to the full guide, you can download simulated reports from Talkwalker’s social listening platform; a tool that will not only track and analyze your data, but create automated reports packed with visuals.
Brand protection
- Crisis management – issue tracking means you’ll identify a crisis before it explodes and damages your brand reputation. Report on the issue and how you dealt with it.
- Share of voice report – who are consumers talking about most, you or your competitors? Why?
Brand performance
- Social network comparison – identify which channels work best for your brand, report how they evolve.
- Brand health report – how effective is your brand in achieving business goals. Track reputation, awareness, engagement, and positioning.
Brand promotion
- Brand reputation – what do consumers think of your brand? A sentiment analysis tool will track and analyse mentions of your brand – assigning a positive, negative, or neutral score.
- Influencer metrics report – how are your influencers performing? Are there influencers you’re not working with?
Takeaway
- Define your business goals
- Define your KPIs
- Choose your social media channels
- Listen to your audience
- Analyse top-performing posts
- Measure influencers
- Present your results
Oh, and most important… check out How to create a social media report. You’ll get a cheat sheet of questions to ask tool providers, real-life brand examples, and trackable metrics. And you’ll find simulated reports from – in my totally biased opinion – the best social listening tool on the market.

