Analyzing website user data and analytics is critical if you want to stay ahead of your product category and market, beat your competitors in the search engines, and build and target your website specifically for your users. When you analyze the data on offer on a daily, weekly or monthly basis, it gives you an up-to-the-moment, bird’s eye view of what is really happening on your website and online.
The first time you look at your website stats you will be very surprised and will learn some important and key lessons. As a result of analyzing and using this data, you can consistently refine your website to higher profits by:
- Targeting top keywords and key phrases
- Selling products people actually want
- Targeting specific products to specific customers
- Making usability changes to your website, content, products and checkout to boost sales literally overnight
- Setting goals and responding to the results
- Hiding products that do not sell, but are good traffic generators, in a corner of your website
Do You Know Your Bounce Rate?
Bounce Rate is a measurement that expresses the percentage of site visitors that enter a single page on your website, and leave without clicking to another page. This is measured in Google Analytics. Bounce rates are reduced by making your website more ‘sticky’ as detailed in ‘Design’.
Do You Know Who your Visitors are?
This is key information if you are only selling to one country. When you look at your statistics, you will find that the majority of your site visitors come from other countries. You may be losing 80% of your traffic because they cannot buy from you!
Are your users PC or Apple Mac users? What is their screen resolution? When does your traffic peak in a 24 hour, weekly, monthly or annual cycle? All of these questions and more will be answered by analyzing site data.
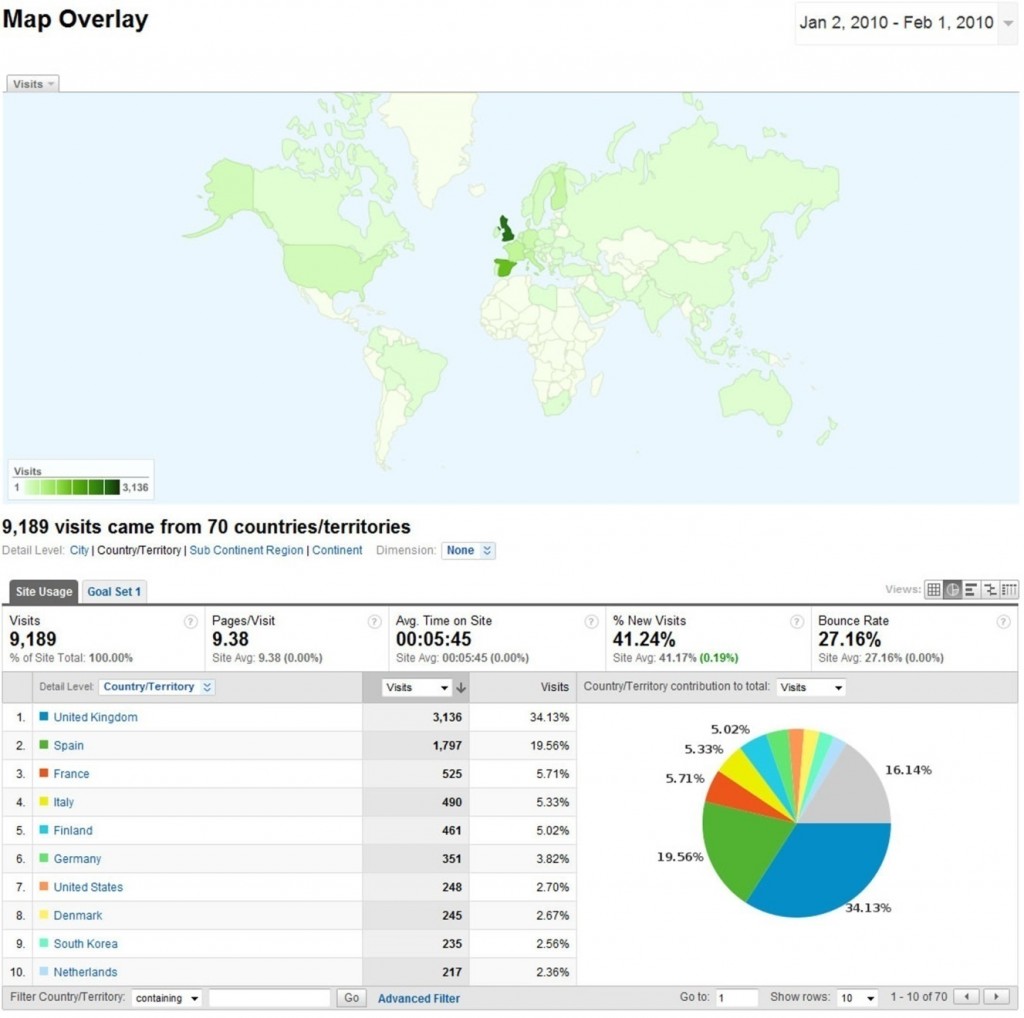
One of the Many Google Analytics Reports Showing Various Site User Data
You Need Traffic To Analyze.
It’s important you get your website traffic up to a reasonable number before you start to analyze, respond and refine your site. If you start with only 10 visitors a day this is not enough to measure and act upon. You need a good mixture of visitors from different demographics and I would wait until you get at least 50–100 people a day so you have enough metrics to judge and get actual and reliable results. The more visitors per day the more accurate the data will be.
I also recommend analyzing at least 90 days to 180 days (3 months to 6 months) at a time, as this will give you a very good mix of users and a good time scale to look at users’ habits and behaviors.
Three Ways to Get User Data:
1. Add Google Analytics code to your website… it’s really easy.
Google Analytics is comprehensive and will tell you everything you need to know about your user’s habits: the buttons and links they click and those they ignore; how much traffic you get and from what country; bounce rates; where they abandon your checkout process; plus lots more information. Your web developer should know about Google analytics – if not, turn and run!
- Sign up for Google Analytics here: www.google.com/analytics/
2. With all standard hosting accounts, you get Web Stats (known as server logs) found in your CPanel (Control Panel). You will need to ask your host for the username and password to access these. Common server stats are AWStats and Webalizer.
3. Your ecommerce software will come with its own reports, statistics and data too. Great for analyzing orders, sales, refunds and product related information.
Test. Test. Test.
Testing and refining is about taking your ecommerce website and business to continually higher levels of growth using the principles detailed in the Key site Elements such as Design, Usability and Conversion. If you analyze, you can respond positively to your available data, reports and statistics—on a monthly basis as a minimum with weekly or daily being optimum. Your competitors will not know what has hit them. The more testing you do and the more website refinement you can implement, ultimately the more products you will sell!
Successful websites including Amazon often run multiple tests on their website daily to gather data and respond to the results. They test everything from a simple image placement on their homepage, product layout, add-to-cart buttons, images, text, colors through to the messages and products you see when you have placed an order—the order confirmation page.
Key Data to Measure.
Here is a brief overview of the key metrics of your website to measure so you can refine your traffic source and quality, lower your bounce rate and increase your conversion rate.
- Unique Visitors or Absolute Unique Visitors – How many individual people came to your site in a day, week, month or year. This is a key statistic to determine if your traffic is consistently growing, remaining static or declining each day, week or month. Do not use visits or hits – use unique visits as this shows you each unique person as one visit.
Determining your Visitor-to-Sales ratio (Conversion Rate):
For example: (a) 1000 unique visitors per day enter your website and (b) 10 individual orders are placed within this period. You divide the number of orders by the total unique visits to determine the visitor-to-sales ratio.
Conversion Rate Calculation: (a) 1000 / (b) 10 = Conversion Rate (i.e. 1 person in every 100 visitors orders from your website)
Expressed as a Percentage: (b) 10 / (a) 1000 x 100 = Conversion Rate of 1%
To determine your monthly or annual visitor-to-sales ratio use the same calculation but add up your total unique visits and orders placed within your desired period of time. Note: Do not use total number of items sold as some people buy more than 1 item per order. You can filter this data further by splitting visits by specific country of origin.
- Page Views – Page views is the total number of pages viewed on your site and is a general measure of how much your site is used. It is more useful as a basic indicator of the traffic load on your site and server rather than as a marketing measure.
- Bounce Rate – Bounce Rate is the percentage of single-page visits (i.e. visits in which the person entered and left your site on the same page without clicking to another page in your site). Bounce Rate is a measure of visit/traffic quality and a high Bounce Rate typically indicates that site entrance (landing) pages aren’t relevant to your visitors. You can minimize Bounce Rates by tailoring landing pages to each keyword and ad that you run. Landing pages should provide the information and services that were promised in the ad copy (the advertising that drew the visitor to your site in the first place).
- Time on Site – Time on Site is one way of measuring visit quality. If visitors spend a long time visiting your site, they may be interacting extensively with it. However, Time on Site can be misleading because visitors often leave browser windows open when they are not actually viewing or using your site.
- New vs. Returning Visits – A high number of new visitors suggests that you are successful at driving traffic to your site while a high number of return visitors suggests that the site content is engaging enough for visitors to come back. You can see how frequently visitors return and how many times they return.
- Country of Origin of Visitor (Map Overlay) – Determine what country and territory your visitors are coming from. Use the available data maps to visualize volume (visits, page views) and quality (page views per visit, conversion rates, per visit value, etc) metrics by geographic region.
Note: It’s important to determine your Visitor-to-Sales Conversion Rate by country as it may be better than you at first thought. If 30% of your traffic is from overseas but you only ship nationally then you can discard the international Unique Visits data from this calculation.
- Direct Traffic – Establish who clicked a bookmark to come to your site or typed your site URL into their browser and find out how they compare to the ‘average’ visitor to your site. Direct traffic can include visitors recruited via offline (i.e. print, television) campaigns. You can also segment direct visits by city, visitor type, or other factors.
- Search Engine Traffic – How much search engine traffic do you get and how does this compare to traffic as a whole to your website? Find out which search engine your traffic comes from. The available graphs detail overall trends from the various search engine traffic.
- Keywords – Establish what keywords and key phrases your visitors are using to find your website. Available graphs show overall trends from each keyword and its traffic origin. You can segment the traffic referrals from each keyword by city, visitor type, or other factors.
What are Conversion Goals?
Goal conversions are the primary metric for measuring how well your site fulfills specific objectives. A goal is a website page a visitor reaches once they have made a purchase or completed another desired action, such as completing a contact form, registration or download.
How can Goals Help Me?
Once you have set your goals, you’ll be able to see conversion rates and the monetary value of the traffic you receive. You can also define a ‘funnel path’ for each goal. A funnel path is the path you want visitors to take to reach a goal. Defining a funnel path allows you to monitor how frequently visitors who begin a conversion process actually complete it.
- Goal 1 (Checkout Cart Abandonment) – Set up this goal funnel on your checkout process from Shopping Cart/Basket page through each page/step to your Order Confirmation Page. This will clearly breakdown and detail how many people enter and leave at each step and how many people complete the checkout process and order from you.
- Goal 2 (Contact Form Submission) – Use this goal to determine how many people enter your contact form page and how many people actually submit the form to you.
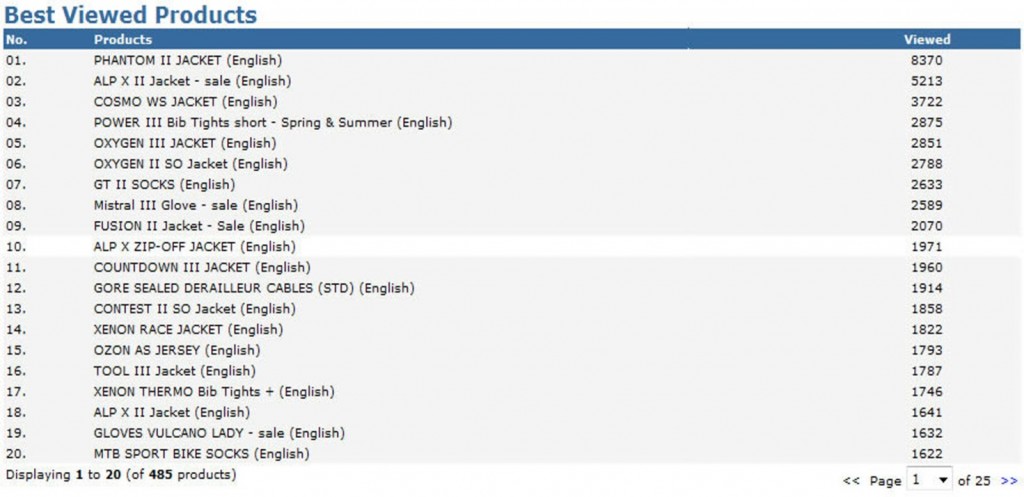
Most Products Viewed Report taken from osCommerce Back-end Admin
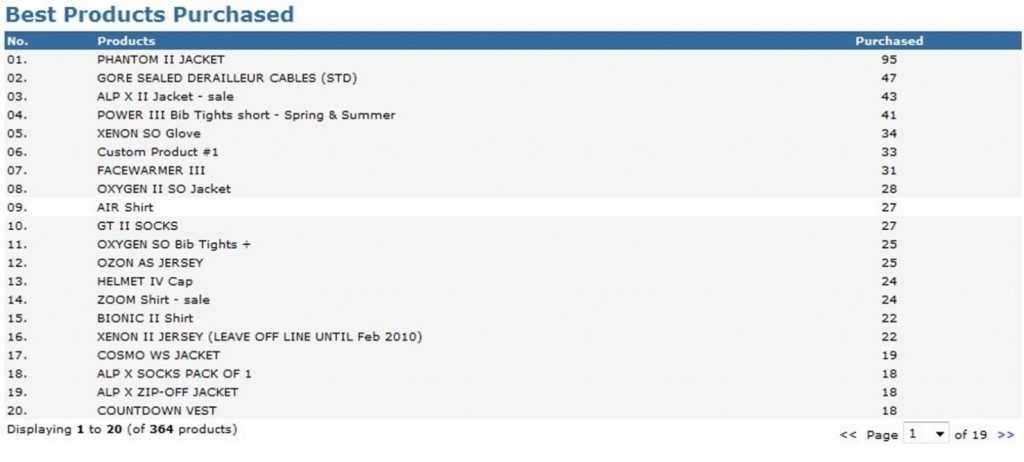
Most Products Purchased Report taken from osCommerce Back-end Admin
Sales Report taken from osCommerce Back-end Admin


