As a marketer, I recognize the many benefits of using social media in marketing. But, it’s easy to get complacent. Then, I read this in the Salesforce blog, “People remember only 20 percent of what they read and 10 percent of what they hear, but retain 80 percent of what they see.”
I thought a gentle reminder would be a good idea.
I recently published a post listing 50 Instagram stats. I won’t include them all here, but you can skip to the post and find them all, if you’re interested. There’s also a cracking infographic.
50 Amazing Instagram Statistics to Fire up Your Marketing Campaigns
Instagram is the boss, when it comes to photo-sharing channels. If your product is easy on the eye, if your product is Instagrammable, you’re missing an opportunity to excel at visual communication if you’re not exploiting Instagram.
Instagrammable?
Products that look great when photographed such as flashy new cars, cosmetics, the latest fashions, tattoos, art – you get the idea.
What about a cup of coffee? You might not consider this a pretty product, but it’s Instagrammable. Say hello to Starbucks’ Unicorn Frappuccino – a simple cup of PINK coffee. Only available for five days, it sold out on the first day, despite widespread opinion that it, “tastes awful.”
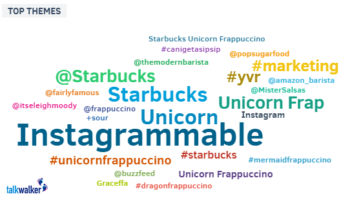
Using visual communication, Starbucks used consumers to sell its product. “The look of the beverage was an important part of its creation, our inspiration came from the fun, spirited and colorful unicorn-themed food and drinks that have been trending in social media.”
Genius!
50 Instagram Statistics
Launched on October 2010, Instagram had one million users within two months. In 2012, Facebook bought the image-based social media channel, and by 2013, users hit 100 million. Today, there are 800 million people sharing images.
This list of Instagram statistics proves the value of Instagram when you’re looking to target consumers and increase brand awareness.
 If you’re considering an Instagram marketing campaign, but you’re not totally sold, check out the Instagram statistics. Proof enough that the channel is gold. Once it’s up and running, you’ll want to measure the impact, check your results, prove ROI, and share with your team. Talkwalker’s social listening tool can help; it can measure, check, and share – take a free demo and we’ll show you how.
Here’re a few teaser stats to tempt you:
- Gender is 50/50 on Instagram, however, female Internet users are 38% more likely to use Instagram compared to men at 26%
- There are 250 million daily users of Instagram stories
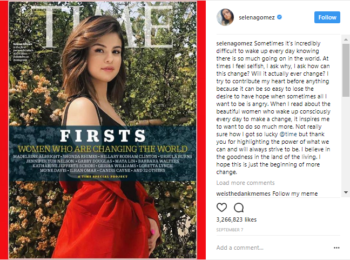
- Selena Gomez leads with 128 million followers on Instagram, that’s more than 20% of Instagram’s entire user base
- Fashionistas check Instagram every day, that’s 15 times per day, and on average, follow 353 accounts
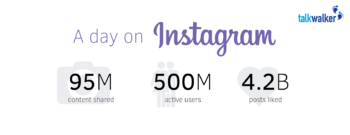
- 95 million photos and videos are shared on Instagram per day
- Users like 4.2 billion posts daily
- There are 8 million registered businesses using Instagram
- Instagram has 2 million advertisers, that’s a 900% growth since the beginning of 2016 – WOW!
- Wednesday and Thursday posts can bring the most engagement, with Sunday bringing the least
- Images featuring blue as the dominant color generate 24% more likes than images that are predominantly red
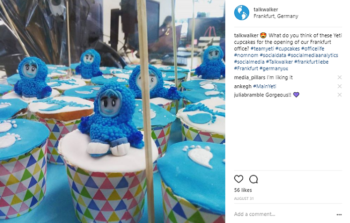
No way, a blue Yeti!
- Pizza is the most Instagrammed food globally, and the most hashtagged. Afters include sushi, steak, burgers, bacon, tacos, donuts…
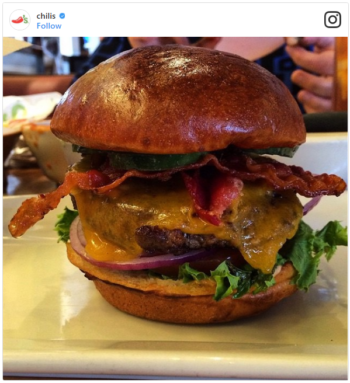
Instagrammable food
No longer an overpriced, understocked platter of nibbles to share with mates.
Check out the full list of Instagram statisics and use them to inspire your marketing campaigns. Visual communication is a thing, it works. Don’t forget…
“90 percent of information your brain absorbs is visual, and visual messages are processed 60,000 times faster than text. Also, people remember only 20 percent of what they read and 10 percent of what they hear, but retain 80 percent of what they see.”

